Skip to content
Would You Rather Math
ASKING STUDENTS TO CHOOSE A PATH AND JUSTIFY IT WITH MATH
  • Home
  • User’s Guide
  • WYR Sample Sheet
  • About Me
  • K-2
  • 3rd-5th
  • 6th-8th
  • 9th-12th
  • French
  • Course Content

Posts

Would You Rather…

May 20, 2016 stevens009

Slide1

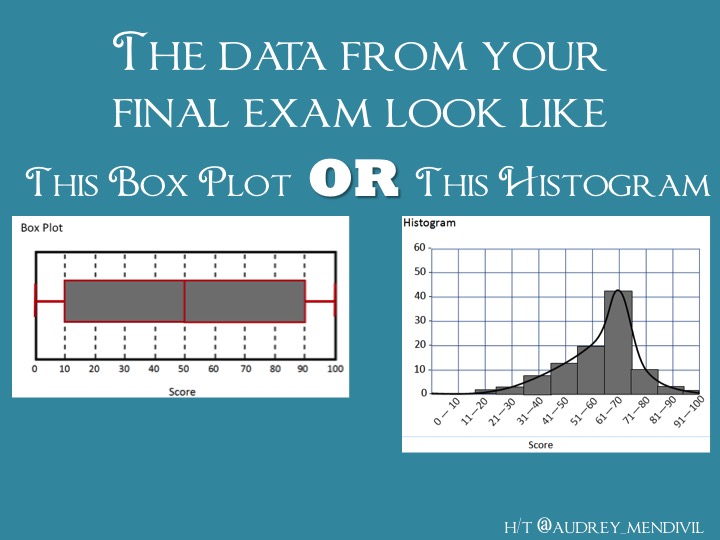
Have the data from your final exams look like the box plot on the left or the histogram on the right?

h/t @audrey_medivil and thanks to @robertkaplinsky
Posted in: 6th-8th, 9th-12th, statistics Filed under: box plots, finals, histograms, stats

Post navigation

← Would You Rather…
Would You Rather… →

Would You Rather Math Mini-Workshop

Register for the online mini-workshop

Want to help keep WYRmath going?

Copyright © 2025 Would You Rather Math — Uptown Style WordPress theme by GoDaddy
Go to mobile version